Dashboard
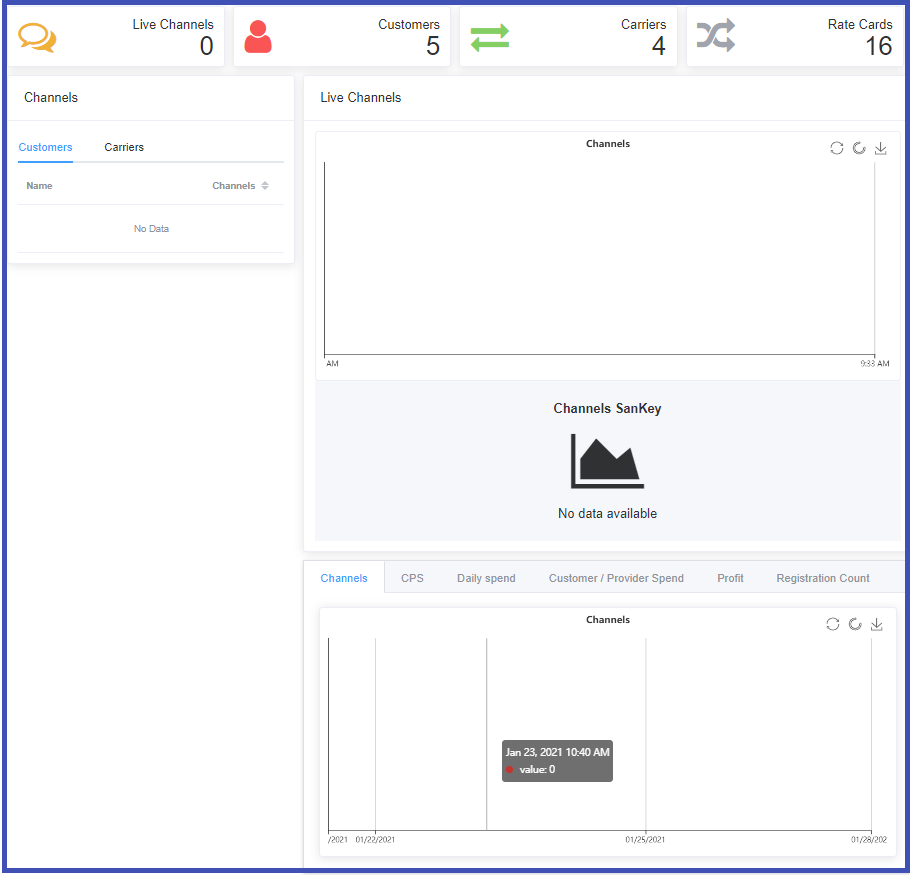
The Dashboard overview provides a summary of active customers and channels, along with some quick functions. For detailed account and customer activities, use the Menu system on the left.
Control Panel Functions

-
Checklist: A quick view of outstanding Alerts on the account to be addressed. Upon initial setup, there are Alerts to verify email and mobile for the account, as well as reminders to create your customers, setup carriers, etc.
-
Time Zone: Click on the Date / Time box to select the Time Zone for your site.
-
Documentation: Click on the question mark to access the ConnexCS Documentation.
-
Account Balance: Displays the current account balance and a link to make a payment using a credit card or PayPal.
-
Channel Count: Total Live Channels currently in use for all customers.
-
Account: Use this to update your Profile, Change Password or Language, or Log Out.
Overview
This provides a view of Live Channels, Customers, Carriers, and Rate Cards

Channels
Table view of configured Customers and Carriers sorted by Channels in Use (highest and lowest).
Live Channels
 Use the icons in the upper right corner to refresh, select options, or download the graph.
Upper graphs:
- Channels: Displays all currently active channels.
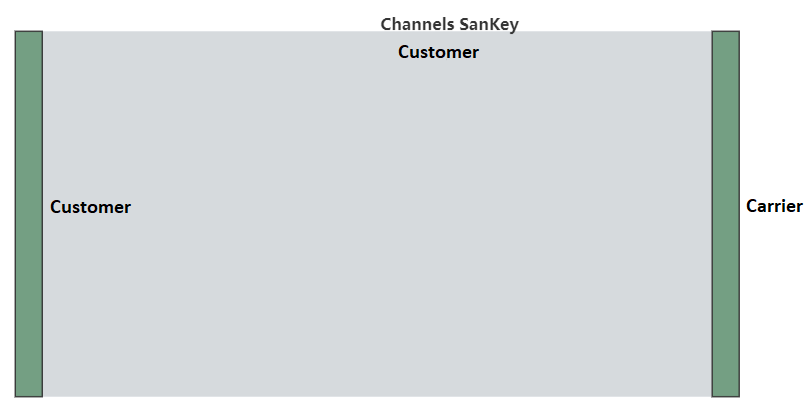
- Channels SanKey: Displays the calls and carriers that are linked together.

Lower graphs:
- Channels (historical data).
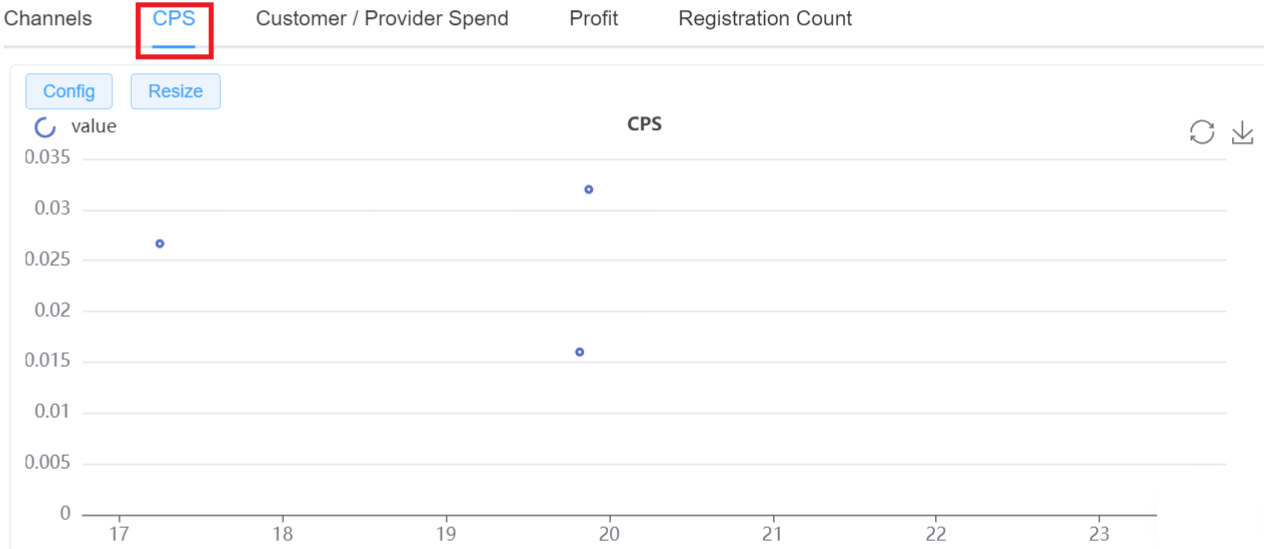
- CPS (calls per second).
- Daily Spend (displayed by customers).
- Customer / Provider spend (from SanKey Diagram above).
- Profit (daily stats on profit and loss, good for analysis).
- Registration Count (currently registered end-points).
Dashboard: Graph Tabs
With this new feature, you can view parameters like Channels, CPS, Customer/Provider Spend, Profit and Registration Count.
You can view the Configuration of the displayed graph. The feature gives you the flexibility for Resizing the graph, Refreshing it and Download it as well.


